Tableau Projects
Project 1: Call Center Dashboard
This is an interactive call center dashboard I created for my final project in my Data Analytics class in Fall 2021. I was given a spreadsheet of raw data and was assigned to use Tableau to organize the data, analyze it, identify trends, and create a visually pleasing dashboard to summarize my findings. In addition to basic KPIs such as total calls, average questions time, and average talk time, I included things such as a month-long timeline that shows the daily calls for any specific agent or department. I also created a horizontal bar chart showing customer satisfaction by day of the week on a scale of 1-5, which can be broken down by department, agent, or day. I included a few other types of interactive visualizations as well.
Click here to view full project.

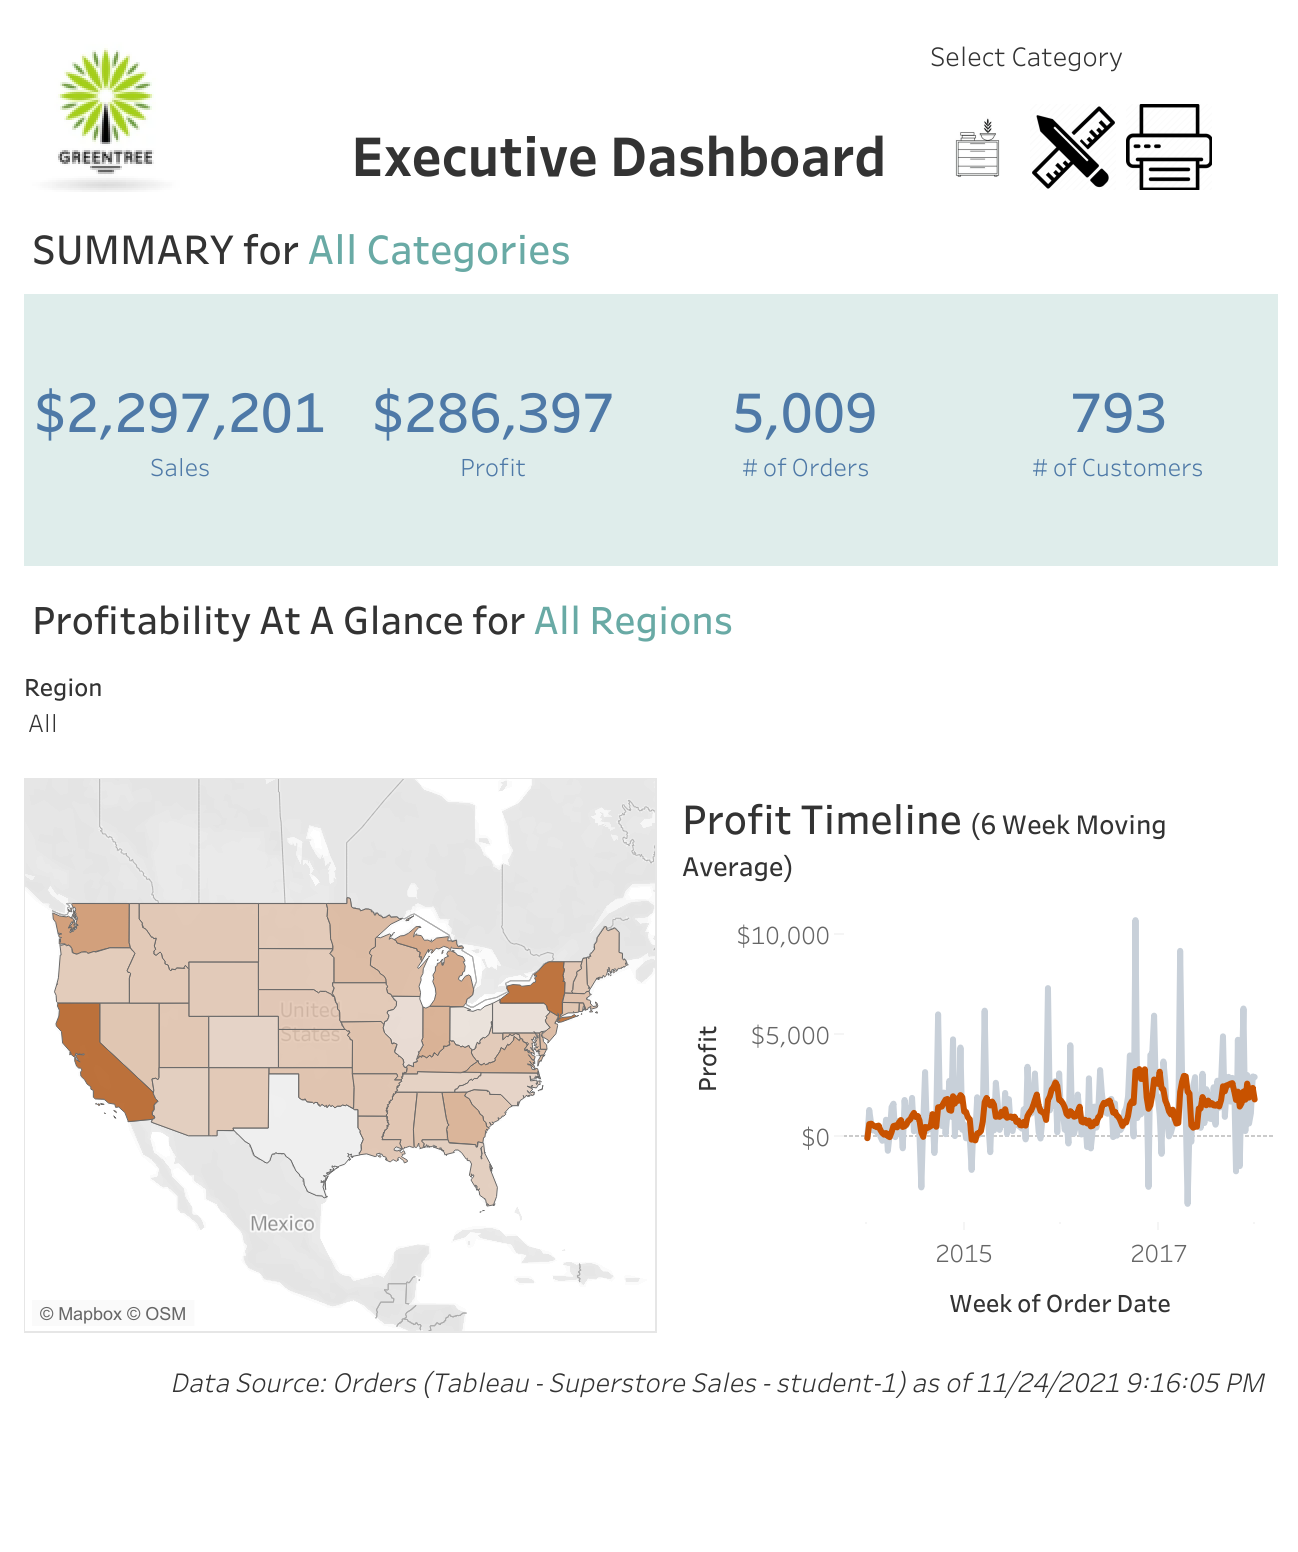
Project 2: Executive Dashboard
This is an interactive dashboard I created for a project in my Data Analytics class in Fall 2021. I was given a spreadsheet of raw data and was assigned to use Tableau to organize the data, analyze it, identify trends, and create a visually pleasing dashboard to summarize my findings. In addition to basic KPIs, I included a map and profit timeline, all of which can be broken down by region to see more in-depth information.